SRUT examination of the annular ring was conducted at 8 equally spaced locations around the circumference of the tank. Each scan was of 1 m in length around the circumference and extended circa 0.8 m into the tank. In addition to this full scanning of annular plates was conducted on 1/4th of the tank (i.e. from 00 to 900 of the tank). These scans revealed little to no corrosion. We found five minor indications and one moderate indication in the annular ring. See the attached schematic drawing of scanning. And for more information refer the drawing No: FIRE WATER TANK (1T – 3302), Detail of Tank Base, Group No: 076-1T-3302.
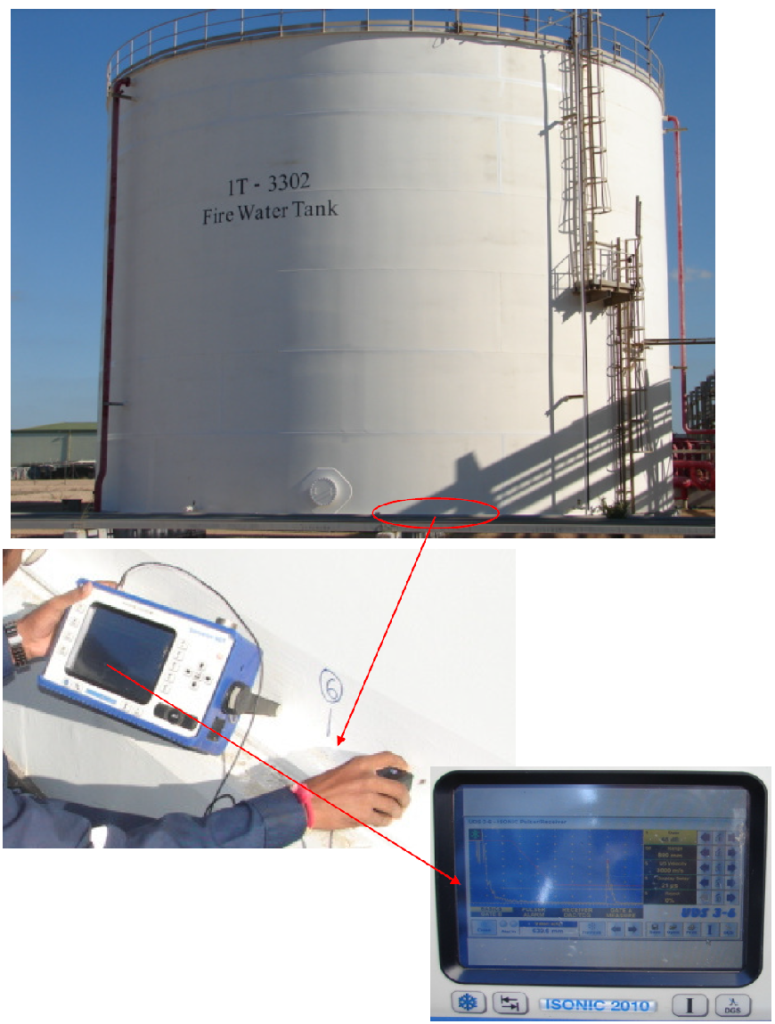
Site location showing SRUT work in progress
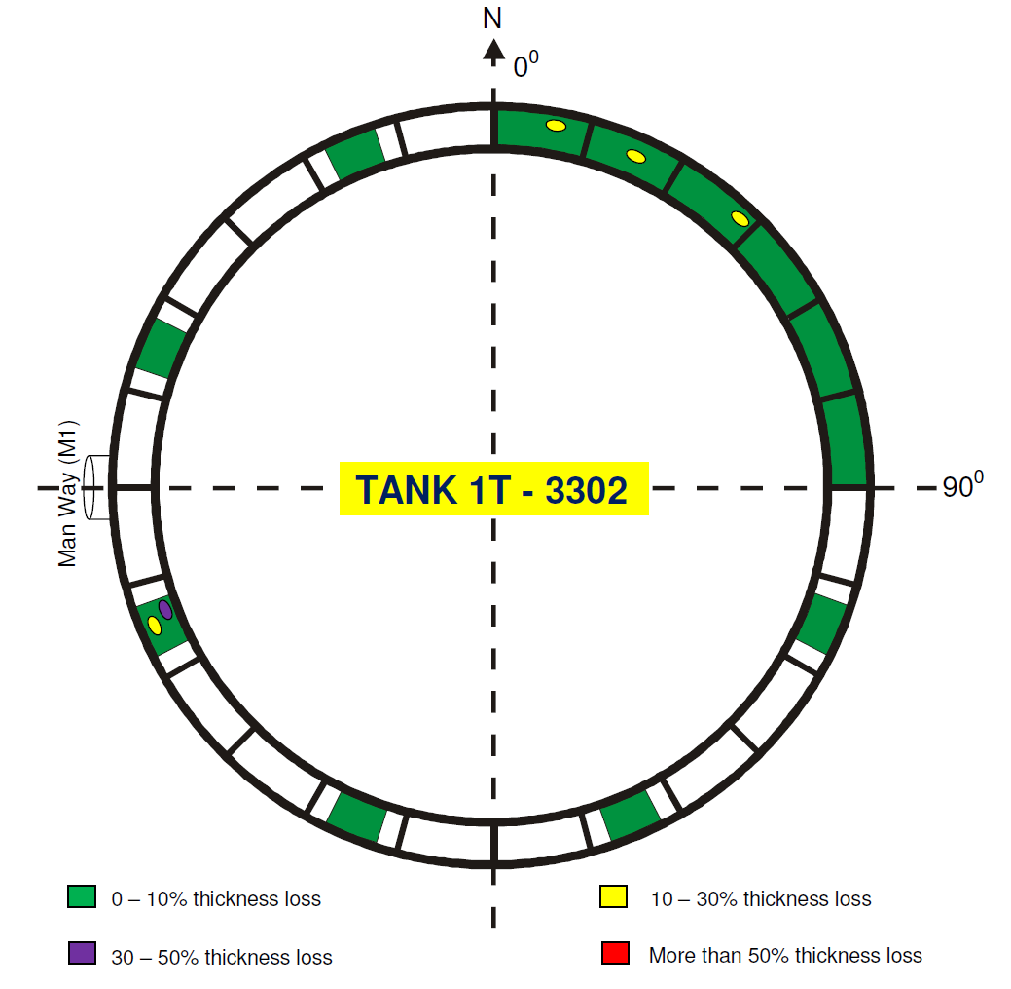
Tank Annular Plate defect diagram
TechCorr were contracted to perform in-service internal floor and external inspection of tank 1T-3302. As a part of this, SRUT examination was conducted to determine the possible thickness loss of the annular ring of the tank 1T-3302 located in at LNG plants in Egypt.
The purpose of this work was to check the presence of metal loss of the annular plates of the tank. Technique utilized on this project was Short-Range Ultrasonic Testing (SRUT), a proven technology to detect metal loss features of annular plates.
Several important characteristics were considered when developing the inspection analysis procedure including coating type (Paint), Tank Diameter (21.5m), nominal wall thickness (12mm), material (ST.44-2), etc. Additionally TechCorr’s inspectors performed a visual inspection around of the annular ring of the tank where the probe was placed. These characteristics and many other technical issues helped the technicians analyze the data collected by the SRUT tools during inspection.
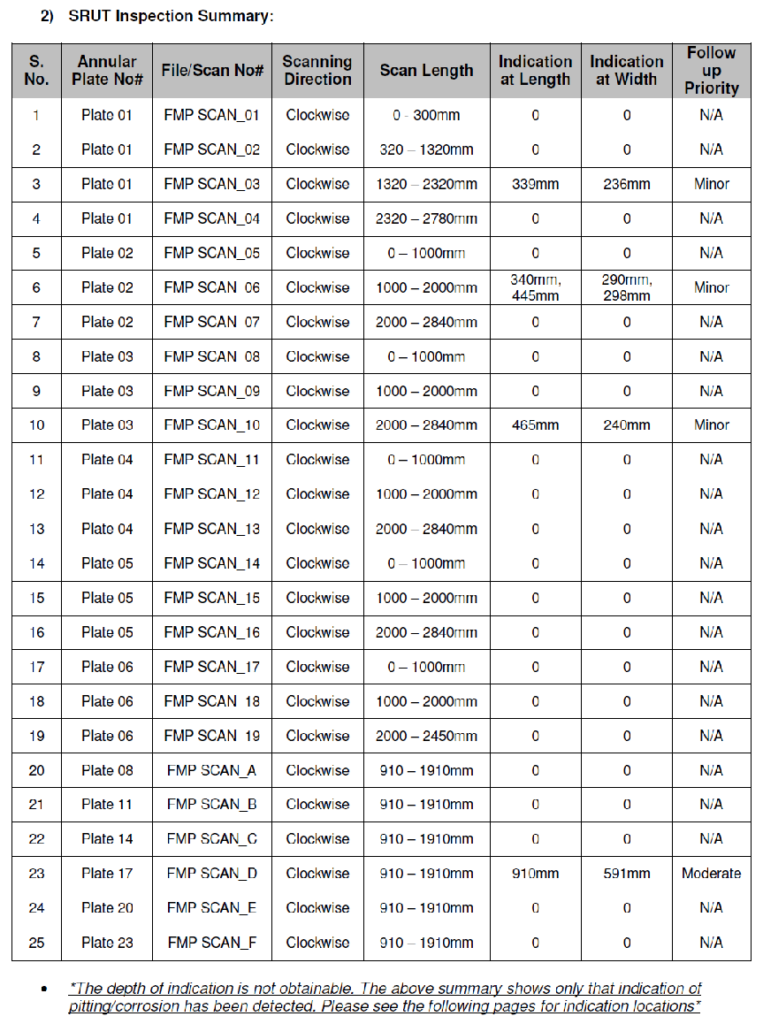
Inspection Summary:
1) Thickness Readings of Annular Plates: Thickness of the annular plates was collected at 8 equally spaced locations around the circumference of the tank. Thickness was collected at the centre of the annular plates listed below.

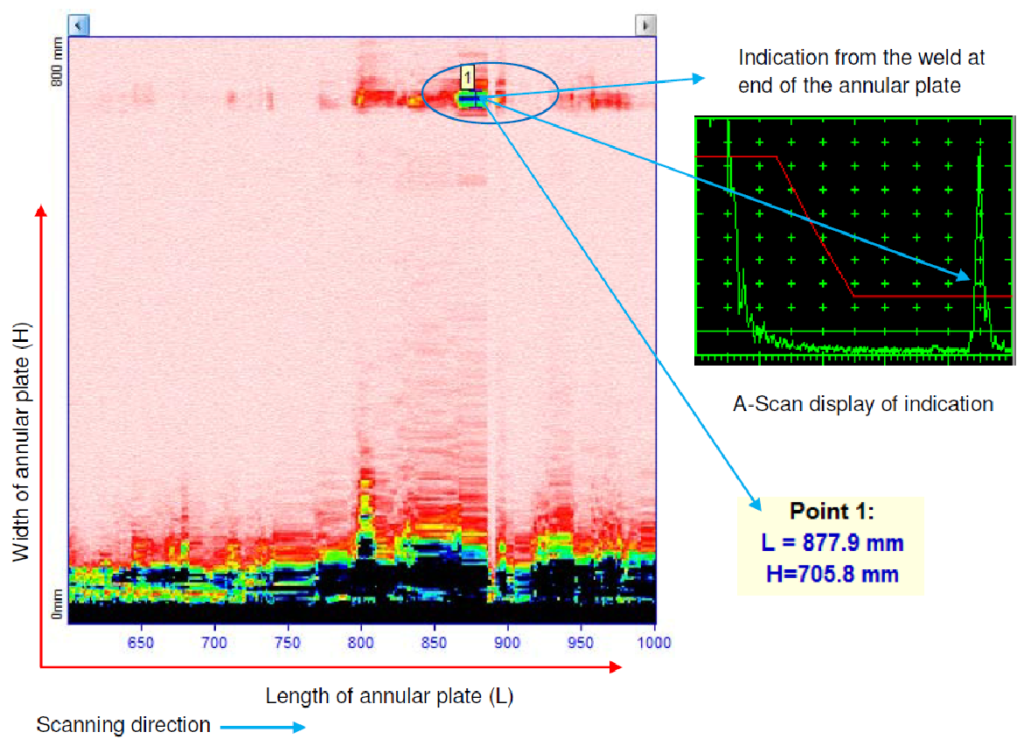
SAMPLE WAVE FORMS
Scan showing Annular Plate with no defect indication
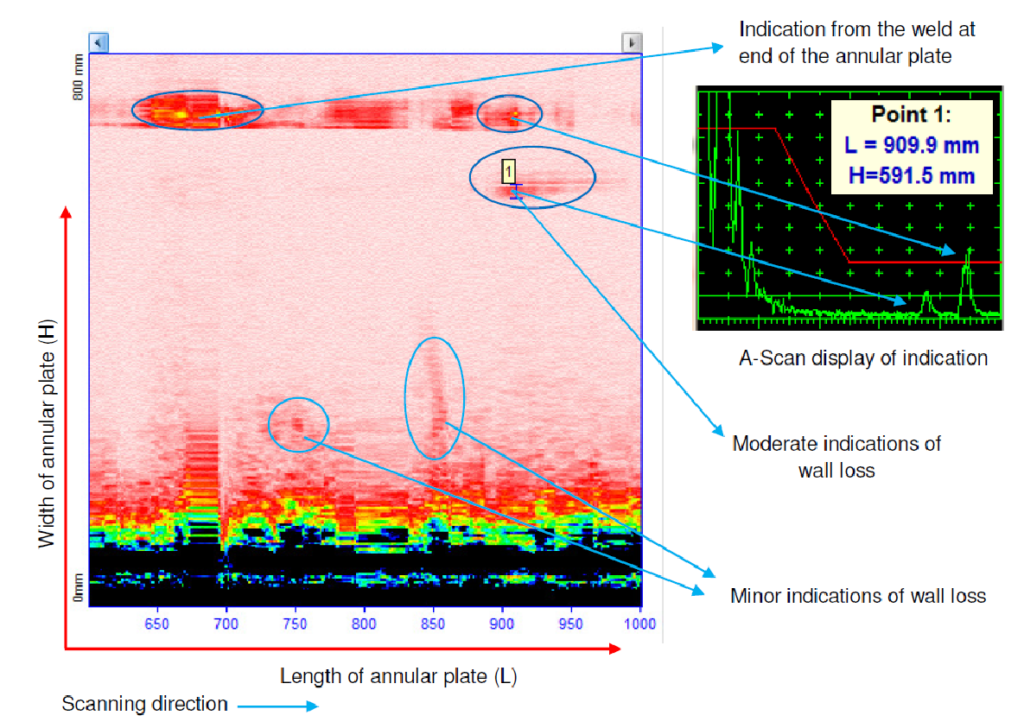
Scan of Annular Plate showing one major and two minor indications